Getting the mail on solar installations

The Australian Energy Council has reviewed the latest Clean Energy Regulator (CER) data to highlight the top suburbs and areas for solar installations by state and territory.
The 20 years of data collected by the CER[[i]](https://www.energycouncil.com.au/analysis/getting-the-mail-on-solar-installations/#_edn1), shows Bundaberg (4670) to be the leading postcode for solar installations, while another three Queensland suburbs are in the top 10 postcodes for the total number of rooftop solar installations. Western Australia also has four postcodes in the top 10 and Victoria has two, see table 1 below.
Table 1: Top 10 Postcodes for solar installations (2001-End of Q1 2021)
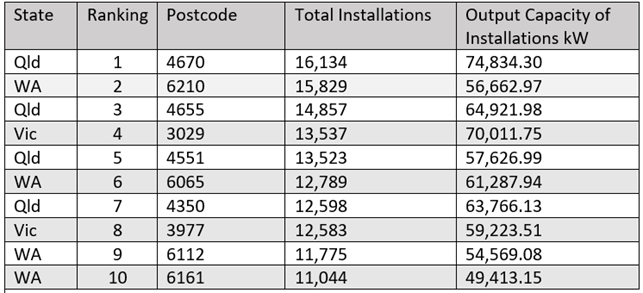
Source: Clean Energy Regulator
But when we look at the first quarter installations this year, there has been a shift in the post codes: of the top 10, two were in Queensland, while New South Wales and Victoria each have three of the leading post codes, and Western Australia has two.
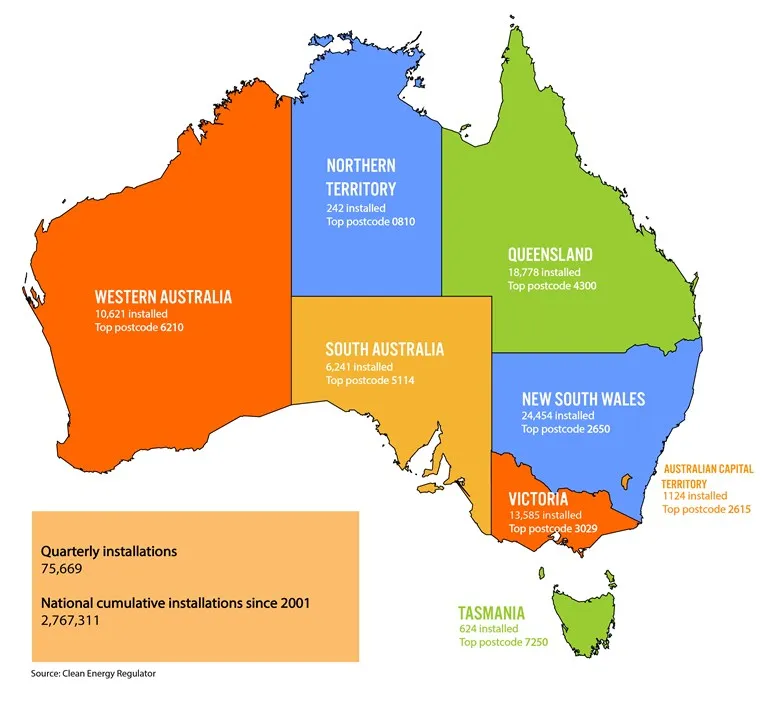
Queensland still recorded the leading post code in the first quarter this year - 4300, which includes suburbs in the City of Ipswich (Springfield, Bellbird Park, Augustine Heights, Camira, Brookwater) - where a total of 650 solar systems were installed in the first three months of 2021. It was followed by the Wagga Wagga area in NSW (post code 2650), which reported 549 solar PV systems installed, and post code 3029 (Hoppers Crossing, Tarneit and Truganina) in Melbourne’s west. The top post codes for each state and territory are included in in the map below which also shows the total number of PV systems installed in each jurisdiction during the first quarter this year.
Figure 1: Quarterly small-scale solar PV installations by state and territory, Q1 2021
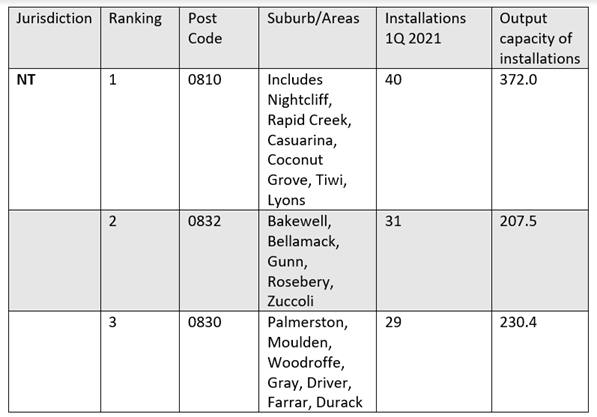
The top three post codes for each jurisdiction in the first quarter 2021 are shown in the following tables.
Table 2: Top post codes Q1 2021, New South Wales
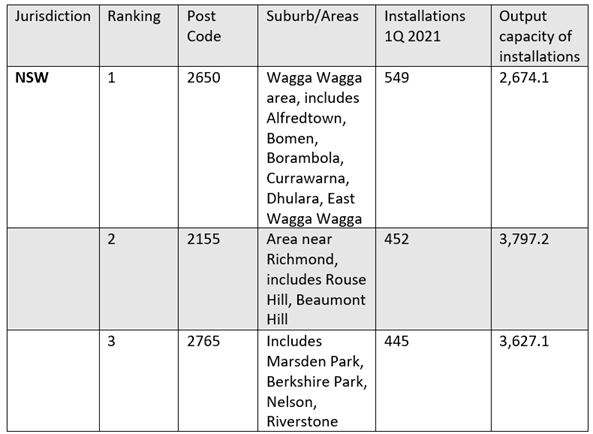
Table 3: Top post codes Q1 2021, Queensland
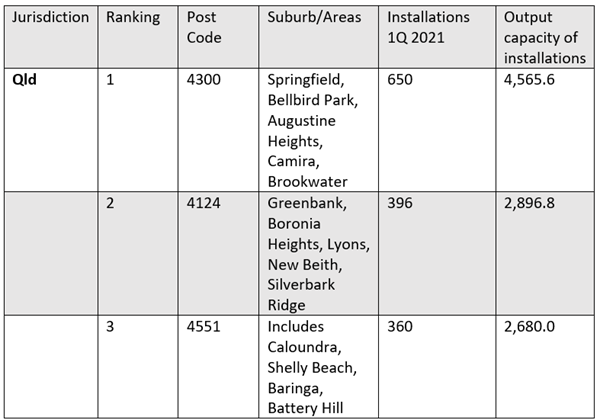
Table 4: Top post codes Q1 2021, Victoria
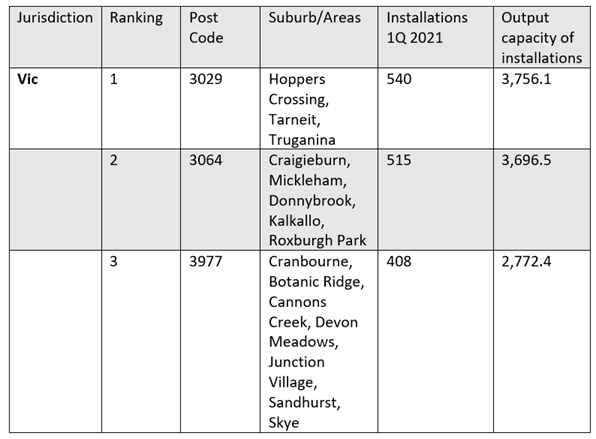
Table 5: Top three post codes, South Australia
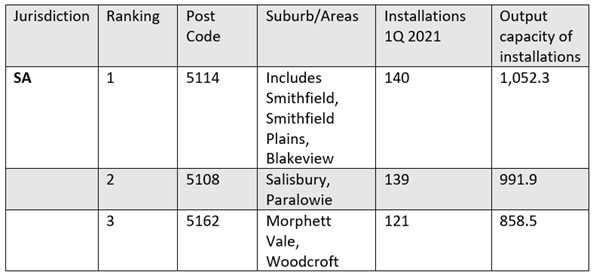
Table 6: Top post codes Q1 2021, ACT
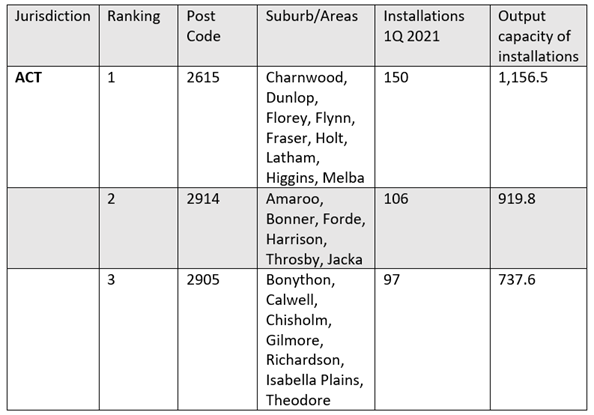
Table 7: Top post codes Q1 2021, Tasmania
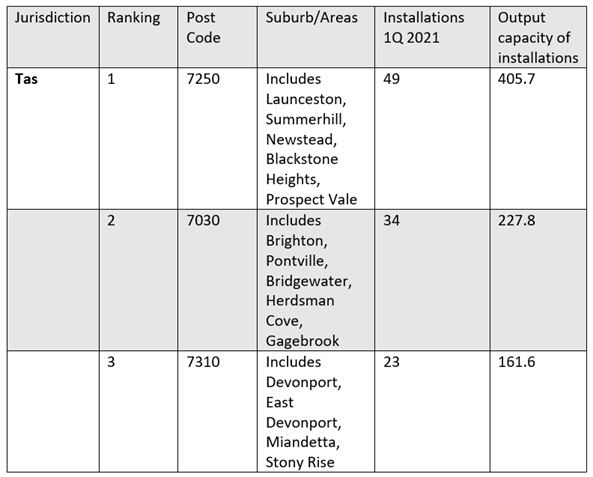
Table 8: Top post codes Q1 2021, Western Australia
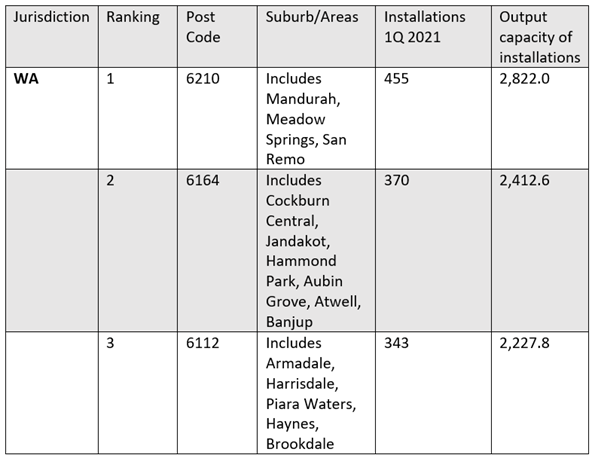
Table 9: Top post codes Q1 2021, Northern Territory
By state, New South Wales has led the annual level of solar installations, followed by Queensland. Queensland previously set the pace for solar system installations prior to 2018.
Last year New South Wales installations reached 109,627, while Queensland rooftops were home to 87,469 new PV systems.
A total of 365,740 systems were installed in 2020, while this year 75,669 systems had been installed in the first quarter (the number of installations by state for 2020 and in the first quarter are shown in table 10). This took the national total to 2.76 million systems with a rated total output of 13,861 MW since 2001
Table 10: Total installations by state and territory, 2001- Q1 2021

Source: Clean Energy Regulator